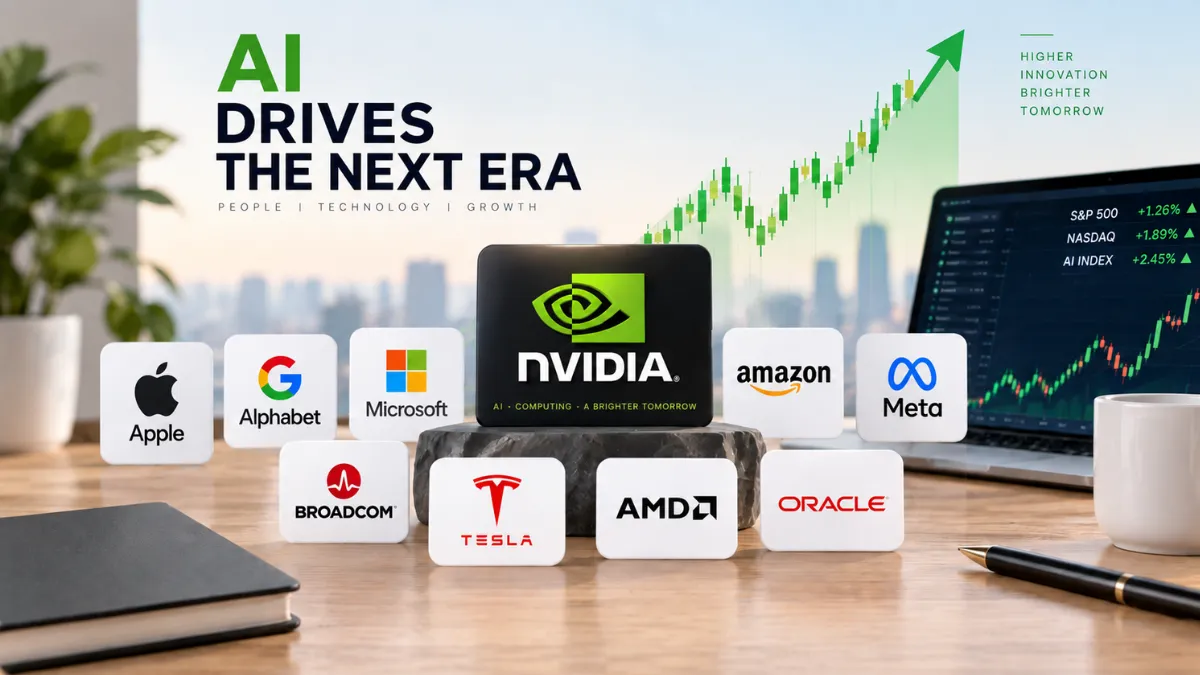
For public-market investors, the AI trade extends far beyond one chipmaker. The Top 10 companies exposed to AI include cloud platforms, semiconductor designers, consumer-device makers and enterprise-software businesses.
Key Takeaways
- NVIDIA leads this ranking based on market capitalization of publicly traded AI-linked stocks.
- The data snapshot is September 16, 2026; fast-moving values should be verified again before publication.
- The ranking shows why AI investing is increasingly an infrastructure-and-platform story rather than a narrow software theme.
- The ranking measures one dimension only and should not be treated as personalized financial or investment advice.
How We Ranked the Top 10
The list ranks publicly traded companies with meaningful AI exposure by market capitalization. A high market value does not mean a stock is cheap, low-risk or a suitable investment.
The primary comparison metric is market capitalization of publicly traded AI-linked stocks. The ranking is designed to be transparent and reproducible rather than subjective.
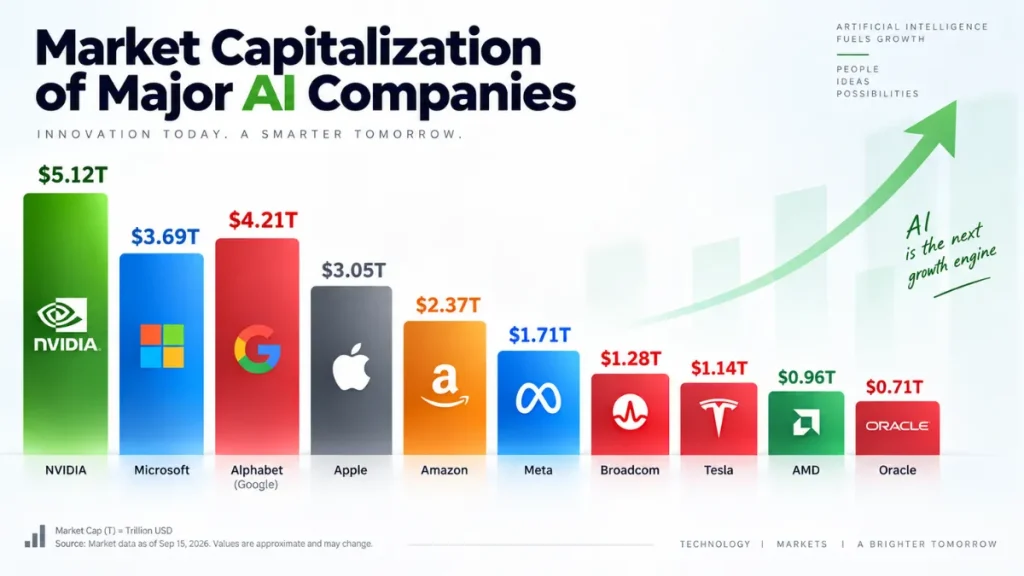
Top 10 at a Glance
| Rank | Name | Latest figure / basis |
|---|---|---|
| 1 | NVIDIA | about $5.12 trillion |
| 2 | Apple | about $4.84 trillion |
| 3 | Alphabet | about $4.18 trillion |
| 4 | Microsoft | about $3.69 trillion |
| 5 | Amazon | about $2.68 trillion |
| 6 | Meta Platforms | about $1.71 trillion |
| 7 | Broadcom | about $1.62 trillion |
| 8 | Tesla | about $1.41 trillion |
| 9 | AMD | about $0.82 trillion |
| 10 | Oracle | about $0.42 trillion |
The Top 10 in Detail
1. NVIDIA
At No. 1, NVIDIA records about $5.12 trillion on the metric used for this ranking. Its position reflects how public or private markets currently price the company’s scale and future opportunity. In technology, those expectations can change quickly as product cycles, AI spending, competition and capital intensity evolve. Market capitalization is therefore a useful measure of size, but not a substitute for revenue growth, profitability, cash flow or valuation analysis.
2. Apple
Apple takes the No. 2 position, with about $4.84 trillion in the latest snapshot. Its position reflects how public or private markets currently price the company’s scale and future opportunity. In technology, those expectations can change quickly as product cycles, AI spending, competition and capital intensity evolve. Market capitalization is therefore a useful measure of size, but not a substitute for revenue growth, profitability, cash flow or valuation analysis.
3. Alphabet
Ranked No. 3, Alphabet stands at about $4.18 trillion based on the methodology above. Its position reflects how public or private markets currently price the company’s scale and future opportunity. In technology, those expectations can change quickly as product cycles, AI spending, competition and capital intensity evolve. Market capitalization is therefore a useful measure of size, but not a substitute for revenue growth, profitability, cash flow or valuation analysis.
4. Microsoft
At No. 4, Microsoft records about $3.69 trillion on the metric used for this ranking. Its position reflects how public or private markets currently price the company’s scale and future opportunity. In technology, those expectations can change quickly as product cycles, AI spending, competition and capital intensity evolve. Market capitalization is therefore a useful measure of size, but not a substitute for revenue growth, profitability, cash flow or valuation analysis.
5. Amazon
Amazon takes the No. 5 position, with about $2.68 trillion in the latest snapshot. Its position reflects how public or private markets currently price the company’s scale and future opportunity. In technology, those expectations can change quickly as product cycles, AI spending, competition and capital intensity evolve. Market capitalization is therefore a useful measure of size, but not a substitute for revenue growth, profitability, cash flow or valuation analysis.
6. Meta Platforms
Ranked No. 6, Meta Platforms stands at about $1.71 trillion based on the methodology above. Its position reflects how public or private markets currently price the company’s scale and future opportunity. In technology, those expectations can change quickly as product cycles, AI spending, competition and capital intensity evolve. Market capitalization is therefore a useful measure of size, but not a substitute for revenue growth, profitability, cash flow or valuation analysis.
7. Broadcom
At No. 7, Broadcom records about $1.62 trillion on the metric used for this ranking. Its position reflects how public or private markets currently price the company’s scale and future opportunity. In technology, those expectations can change quickly as product cycles, AI spending, competition and capital intensity evolve. Market capitalization is therefore a useful measure of size, but not a substitute for revenue growth, profitability, cash flow or valuation analysis.
8. Tesla
Tesla takes the No. 8 position, with about $1.41 trillion in the latest snapshot. Its position reflects how public or private markets currently price the company’s scale and future opportunity. In technology, those expectations can change quickly as product cycles, AI spending, competition and capital intensity evolve. Market capitalization is therefore a useful measure of size, but not a substitute for revenue growth, profitability, cash flow or valuation analysis.
9. AMD
Ranked No. 9, AMD stands at about $0.82 trillion based on the methodology above. Its position reflects how public or private markets currently price the company’s scale and future opportunity. In technology, those expectations can change quickly as product cycles, AI spending, competition and capital intensity evolve. Market capitalization is therefore a useful measure of size, but not a substitute for revenue growth, profitability, cash flow or valuation analysis.
10. Oracle
At No. 10, Oracle records about $0.42 trillion on the metric used for this ranking. Its position reflects how public or private markets currently price the company’s scale and future opportunity. In technology, those expectations can change quickly as product cycles, AI spending, competition and capital intensity evolve. Market capitalization is therefore a useful measure of size, but not a substitute for revenue growth, profitability, cash flow or valuation analysis.
What This Ranking Tells Us
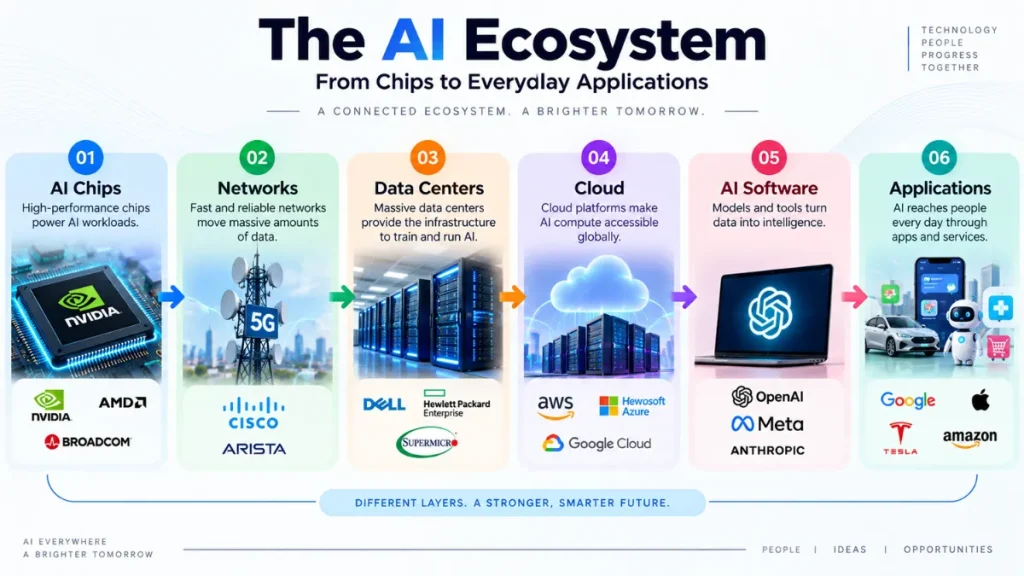
The ranking shows why AI investing is increasingly an infrastructure-and-platform story rather than a narrow software theme.
Why technology market values are so large
Many leading technology firms combine high gross margins, global distribution and recurring revenue with the ability to reinvest at scale. AI has added another capital-intensive growth cycle involving chips, networks, power, data centers and software. Investors have rewarded companies that appear to control scarce infrastructure or distribution.
The concentration question
High market concentration creates both opportunity and risk. A small group of companies can drive a large share of index returns, but their valuations also become more sensitive to earnings surprises, regulation, competition and changes in capital spending. Investors should distinguish a strong company from a stock whose price already assumes exceptional execution.
Important Limitations
Rankings simplify complex subjects. Market capitalization changes with share prices; earnings can include unusual items; AUM moves with flows and asset prices; bank assets depend on accounting definitions; macroeconomic data can be revised; savings rates can change without notice; and real-estate samples differ by provider. For that reason, InvestorBytes recommends keeping the data date visible and linking to the underlying source.
Financial disclaimer: This content is for general informational and educational purposes only and is not personalized financial, investment, tax or legal advice.
Frequently Asked Questions
Who ranks No. 1 in this list?
NVIDIA ranks first based on market capitalization of publicly traded AI-linked stocks in the September 16, 2026 data snapshot used for this article.
How often can this ranking change?
Fast-moving market, rate and price rankings can change daily. Annual macroeconomic and regulatory datasets usually change less frequently but may still be revised.
Does a higher ranking mean it is a better investment?
No. Size, yield, past return or AUM is not an investment recommendation. Risk, valuation, time horizon and personal financial circumstances matter.
Why might another website show different numbers?
Sources can use different reporting dates, currencies, definitions, data vendors or methods. That is why this article states its metric and data date.
How should this article be updated?
Before a future republish, refresh the comparison table from the cited primary or high-quality data source, change the data-as-of date, and revise any item whose rank moved materially.