GBPUSD Soars, But Will the Rally Hold?
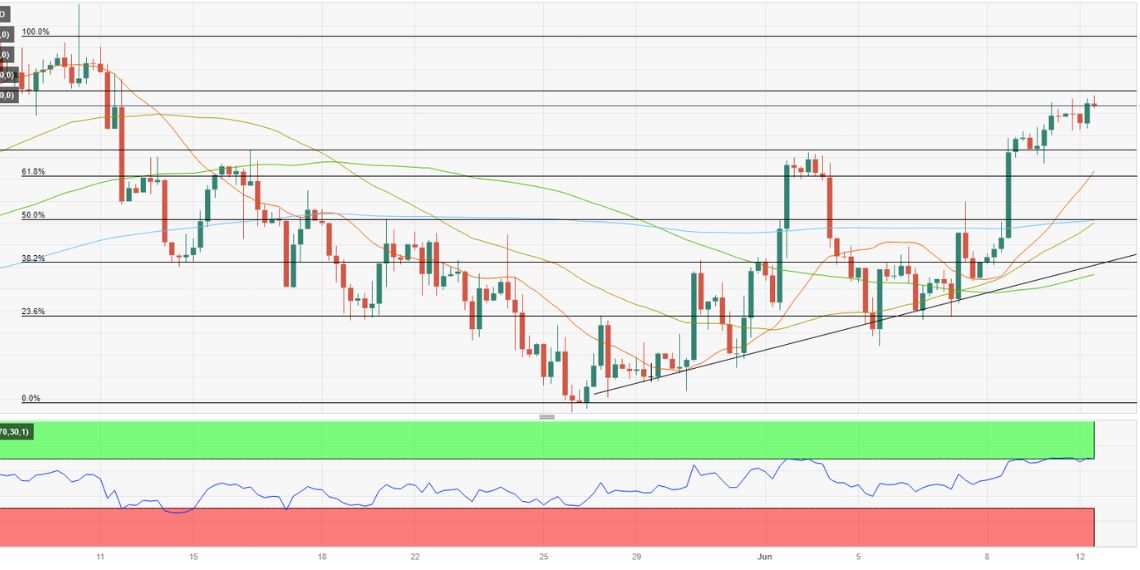
The British Pound (GBP) has been surging against the US Dollar (USD) recently, reaching its highest level since mid-March at around 1.2755. This indicates a strengthening pound, making it more expensive to buy one pound with dollars. However, some analysts are cautious and suggest that this rally might be losing momentum.
Reasons for the Rise
Recovery from Lows
The GBPUSD pair has been steadily climbing after bottoming out earlier in 2024 at 1.2298. While the specific reasons for this recovery aren’t detailed, could it be due to a combination of economic factors and market sentiment?
Signs of a Potential Slowdown
Overbought Conditions
Technical indicators, which analyze price movements, suggest that the uptrend might be overstretched. Does this mean the pound’s rise is unsustainable and might reverse soon?
Short-lived Peak
The recent surge saw the GBPUSD reach a high point but then quickly experience some losses. Could this be a sign of traders taking profits and cashing in on the gains?
Potential Future Movement
Upside Potential
If the rally continues, could the next targets be the December 2023 high of 1.2826 or even the July 2023 resistance level around 1.2994? These historical price points previously stalled the pound’s rise, but will they do so again?
Downside Risks
If the trend reverses, the pound might weaken back to its recent support levels. These levels act as potential “floors” where the price might find buyers and bounce back. Could the first potential support at 1.2669, followed by 1.2598, which held firm in January and March, be tested again? And what if the February bottom of 1.2517 is broken? Would that be a stronger signal of a weakening pound?
Key Indicators to Watch
50-Day Simple Moving Average (SMA)
The 50-day SMA is a common measure of momentum. If the GBPUSD falls below this indicator, could it be a significant sign that the short-term outlook for the pound is turning bearish, indicating a potential decline?
What has caused the British Pound to strengthen against the US Dollar?
The British Pound has been strengthening against the US Dollar due to a recovery from lows earlier in 2024.
What are the potential upside targets if the rally continues?
If the rally continues, the next potential targets could be the December 2023 high of 1.2826 and the July 2023 resistance level around 1.2994. These historical levels previously stalled the pound’s rise and might do so again.
What support levels should traders watch if the pound starts to weaken?
If the pound starts to weaken, traders should watch the recent support levels at 1.2669, followed by 1.2598, which held firm in January and March. The most significant support level to monitor is the February bottom of 1.2517. A break below this level would be a stronger signal of a potential decline.
How significant is the 50-day Simple Moving Average (SMA) for the GBPUSD pair?
The 50-day SMA is a critical technical indicator that measures the momentum of the GBPUSD pair. If the pair falls below this average, it could be a significant sign that the short-term outlook for the pound is turning bearish, indicating a potential decline in value.