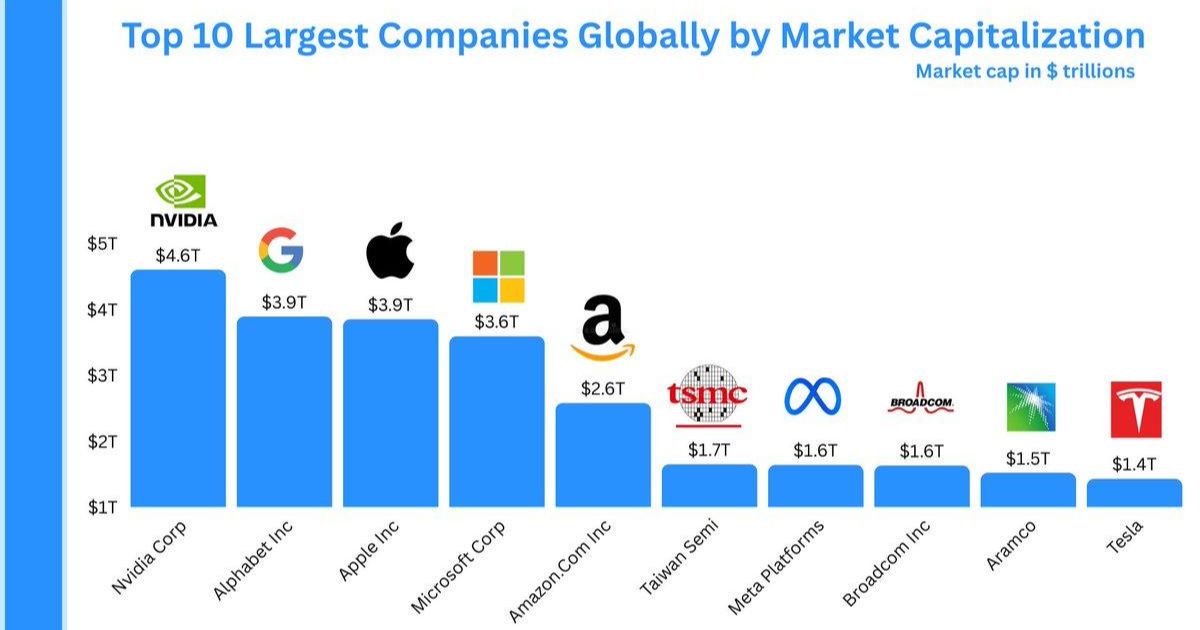
Global equity markets in 2026 remain heavily influenced by artificial intelligence, cloud computing, semiconductors and mega-cap platforms. This ranking looks at the world’s largest companies by market capitalization, a measure of what public and private markets currently assign to a company’s equity value.
Key Takeaways
- NVIDIA leads this ranking based on market capitalization.
- The data snapshot is September 16, 2026; fast-moving values should be verified again before publication.
- The list illustrates just how much global equity value is now concentrated in technology, AI infrastructure and digital platforms.
- The ranking measures one dimension only and should not be treated as personalized financial or investment advice.
How We Ranked the Top 10
Companies are ordered by estimated market capitalization using a September 2026 market snapshot. Market values move every trading day, and private-company estimates can change when new funding rounds or secondary-market transactions occur.
The primary comparison metric is market capitalization. The ranking is designed to be transparent and reproducible rather than subjective.
Top 10 at a Glance
| Rank | Name | Latest figure / basis |
|---|---|---|
| 1 | NVIDIA | about $5.12 trillion |
| 2 | Apple | about $4.84 trillion |
| 3 | Alphabet | about $4.18 trillion |
| 4 | Microsoft | about $3.69 trillion |
| 5 | Amazon | about $2.68 trillion |
| 6 | TSMC | about $2.15 trillion |
| 7 | SpaceX | about $1.89 trillion |
| 8 | Meta Platforms | about $1.71 trillion |
| 9 | Saudi Aramco | about $1.65 trillion |
| 10 | Broadcom | about $1.62 trillion |
The Top 10 in Detail
1. NVIDIA

At No. 1, NVIDIA records about $5.12 trillion on the metric used for this ranking. The ranking captures a single financial dimension at a specific point in time. It should be paired with fundamentals such as revenue, earnings quality, free cash flow, balance-sheet strength and valuation. Large values can signal scale and market confidence, but they can also embed very demanding expectations about future performance.
2. Apple
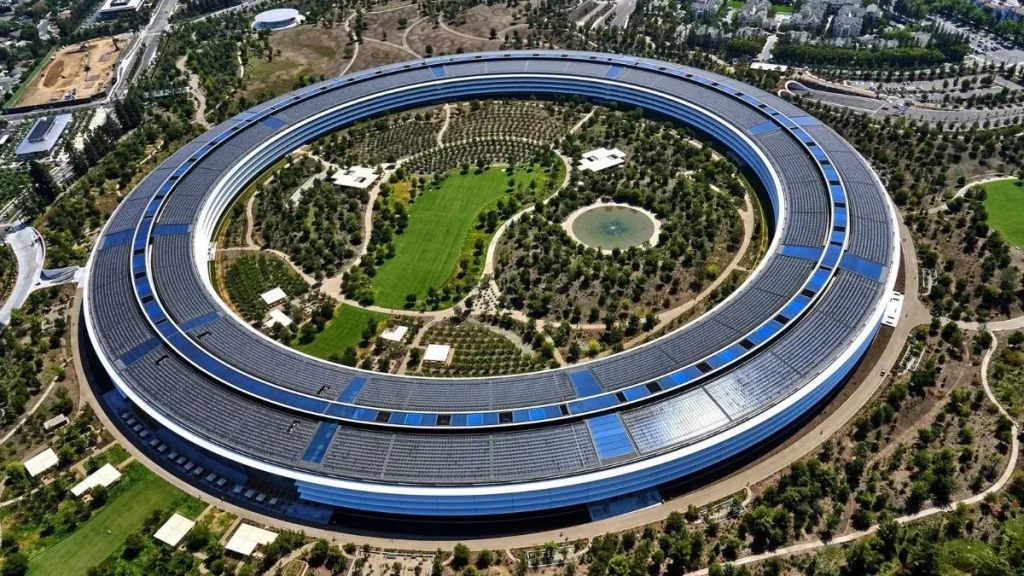
Apple takes the No. 2 position, with about $4.84 trillion in the latest snapshot. The ranking captures a single financial dimension at a specific point in time. It should be paired with fundamentals such as revenue, earnings quality, free cash flow, balance-sheet strength and valuation. Large values can signal scale and market confidence, but they can also embed very demanding expectations about future performance.
3. Alphabet

Ranked No. 3, Alphabet stands at about $4.18 trillion based on the methodology above. The ranking captures a single financial dimension at a specific point in time. It should be paired with fundamentals such as revenue, earnings quality, free cash flow, balance-sheet strength and valuation. Large values can signal scale and market confidence, but they can also embed very demanding expectations about future performance.
4. Microsoft

At No. 4, Microsoft records about $3.69 trillion on the metric used for this ranking. The ranking captures a single financial dimension at a specific point in time. It should be paired with fundamentals such as revenue, earnings quality, free cash flow, balance-sheet strength and valuation. Large values can signal scale and market confidence, but they can also embed very demanding expectations about future performance.
5. Amazon

Amazon takes the No. 5 position, with about $2.68 trillion in the latest snapshot. The ranking captures a single financial dimension at a specific point in time. It should be paired with fundamentals such as revenue, earnings quality, free cash flow, balance-sheet strength and valuation. Large values can signal scale and market confidence, but they can also embed very demanding expectations about future performance.
6. TSMC
Ranked No. 6, TSMC stands at about $2.15 trillion based on the methodology above. The ranking captures a single financial dimension at a specific point in time. It should be paired with fundamentals such as revenue, earnings quality, free cash flow, balance-sheet strength and valuation. Large values can signal scale and market confidence, but they can also embed very demanding expectations about future performance.
7. SpaceX

At No. 7, SpaceX records about $1.89 trillion on the metric used for this ranking. The ranking captures a single financial dimension at a specific point in time. It should be paired with fundamentals such as revenue, earnings quality, free cash flow, balance-sheet strength and valuation. Large values can signal scale and market confidence, but they can also embed very demanding expectations about future performance.
8. Meta Platforms
Meta Platforms takes the No. 8 position, with about $1.71 trillion in the latest snapshot. The ranking captures a single financial dimension at a specific point in time. It should be paired with fundamentals such as revenue, earnings quality, free cash flow, balance-sheet strength and valuation. Large values can signal scale and market confidence, but they can also embed very demanding expectations about future performance.
9. Saudi Aramco

Ranked No. 9, Saudi Aramco stands at about $1.65 trillion based on the methodology above. The ranking captures a single financial dimension at a specific point in time. It should be paired with fundamentals such as revenue, earnings quality, free cash flow, balance-sheet strength and valuation. Large values can signal scale and market confidence, but they can also embed very demanding expectations about future performance.
10. Broadcom
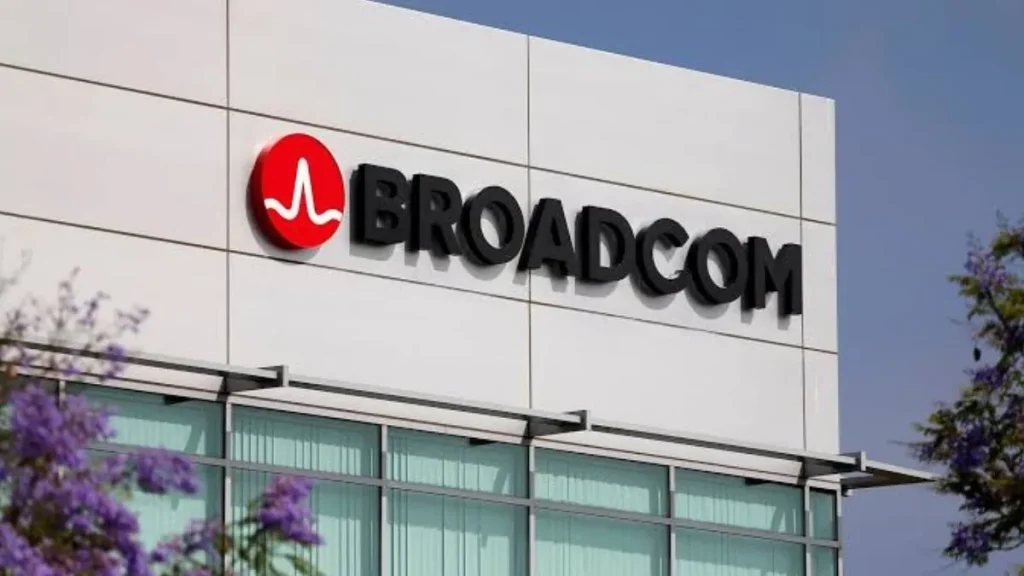
At No. 10, Broadcom records about $1.62 trillion on the metric used for this ranking. The ranking captures a single financial dimension at a specific point in time. It should be paired with fundamentals such as revenue, earnings quality, free cash flow, balance-sheet strength and valuation. Large values can signal scale and market confidence, but they can also embed very demanding expectations about future performance.
What This Ranking Tells Us
The list illustrates just how much global equity value is now concentrated in technology, AI infrastructure and digital platforms.
What the ranking reveals
This table is designed to answer a narrow question using market capitalization. It gives readers a quick way to compare scale, but the most useful insight comes from asking why the leaders are so large and whether the factors behind that leadership are durable. Industry structure, margins, capital intensity and investor expectations can matter as much as the headline number.
How to use this list responsibly
Treat the ranking as a research starting point, not a buy list. For public companies, review financial statements, cash flow, debt, valuation and competitive position. For historical performance lists, remember that the strongest past returns can be followed by much weaker results. A well-formatted table is useful, but the methodology and limitations are what make the article trustworthy.
Important Limitations
Rankings simplify complex subjects. Market capitalization changes with share prices; earnings can include unusual items; AUM moves with flows and asset prices; bank assets depend on accounting definitions; macroeconomic data can be revised; savings rates can change without notice; and real-estate samples differ by provider. For that reason, InvestorBytes recommends keeping the data date visible and linking to the underlying source.
Financial disclaimer: This content is for general informational and educational purposes only and is not personalized financial, investment, tax or legal advice.
Frequently Asked Questions
Who ranks No. 1 in this list?
NVIDIA ranks first based on market capitalization in the September 16, 2026 data snapshot used for this article.
How often can this ranking change?
Fast-moving market, rate and price rankings can change daily. Annual macroeconomic and regulatory datasets usually change less frequently but may still be revised.
Does a higher ranking mean it is a better investment?
No. Size, yield, past return or AUM is not an investment recommendation. Risk, valuation, time horizon and personal financial circumstances matter.
Why might another website show different numbers?
Sources can use different reporting dates, currencies, definitions, data vendors or methods. That is why this article states its metric and data date.
How should this article be updated?
Before a future republish, refresh the comparison table from the cited primary or high-quality data source, change the data-as-of date, and revise any item whose rank moved materially.