You have $20,000 sitting in cash. It came from a bonus, a home sale, or years of patient saving. Now you face a question that stops many investors cold. Should you invest the full amount today, or spread it across the next 12 months?
That choice has a name on each side. Investing gradually is called dollar cost averaging. Investing all at once is called lump sum investing. Most articles answer the question with opinion. This one answers it with evidence.
Below, we walk through both strategies, the math behind them, and what decades of market history actually show. We also cover the part the data cannot measure: how you are likely to behave when your portfolio drops. By the end, you will know which trade you are making and why.
1. What Is Dollar Cost Averaging?
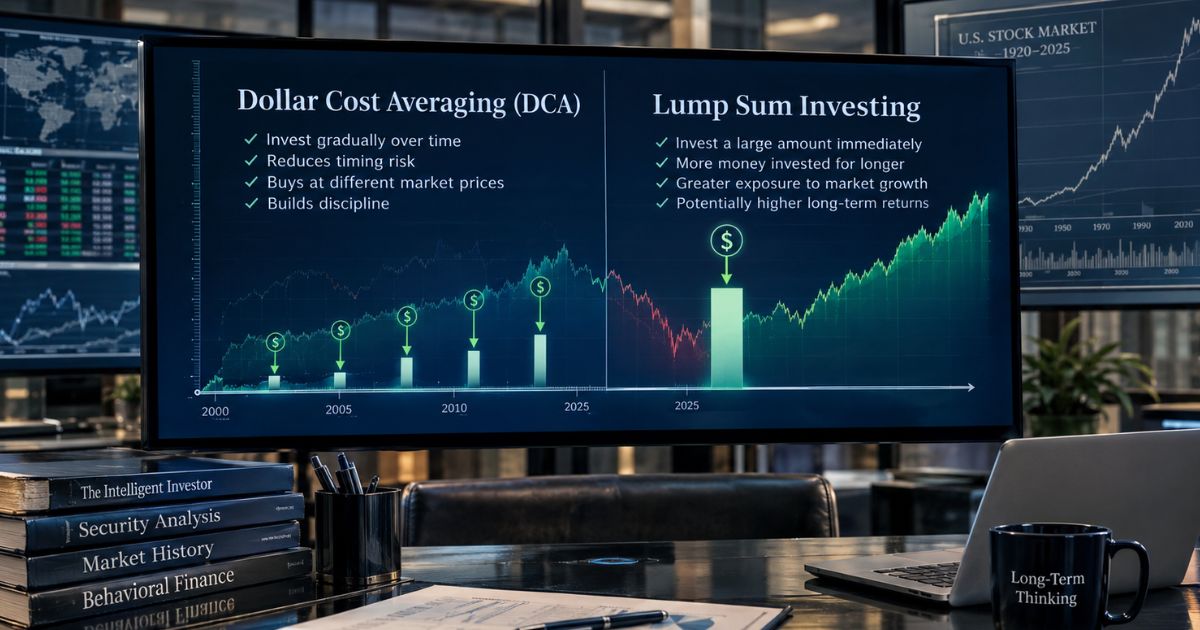
Dollar cost averaging means investing a fixed amount of money at set intervals, no matter what prices are doing. You commit to the schedule, not the forecast.
With $20,000 spread over 12 months, you invest about $1,666 each month. When prices fall, that fixed amount buys more shares. When prices rise, it buys fewer. Over time, your average cost per share reflects a range of prices rather than a single day.
A simple example
| Month | Investment | Share Price | Shares Purchased |
|---|---|---|---|
| 1 | $1,666 | $100 | 16.66 |
| 2 | $1,666 | $90 | 18.51 |
| 3 | $1,666 | $110 | 15.15 |
| 4 | $1,666 | $95 | 17.54 |
Advantages
- You avoid putting your entire balance in at one price.
- The routine removes guesswork from each decision.
- Short term swings feel less threatening.
Disadvantages
- Most of your money stays in cash for months.
- You may miss gains while you wait.
- More transactions can mean more fees in some accounts.
2. What Is Lump Sum Investing?
Lump sum investing means putting the entire available amount to work immediately. Your $20,000 becomes $20,000 invested today, in one transaction.
The logic rests on a single idea. If markets tend to rise over long periods, then money invested sooner has more time to compound. Every month your cash waits is a month it earns cash returns instead of portfolio returns.
Still, the approach carries real drawbacks. You accept full market exposure at one price on one day. If a decline follows within weeks, you feel the whole drop at once. That experience is hard, even for investors who understand the math.
The psychological weight also grows with the dollar amount. Moving $2,000 in a single trade feels routine. Moving $200,000 rarely does.
3. DCA vs Lump Sum: The Core Difference
| Factor | Dollar Cost Averaging | Lump Sum |
|---|---|---|
| Initial investment | Gradual | Immediate |
| Cash sitting uninvested | More | Less |
| Market timing risk | Reduced | Higher at the start |
| Time in market | Lower | Higher |
| Psychological comfort | Usually higher | Often harder |
| Potential long term return | Depends on the market path | Often benefits from earlier exposure |
Here is the distinction that matters most. Dollar cost averaging reduces the risk of picking a bad entry day, yet it also delays your exposure to market growth. You buy comfort with expected return.
That is the central trade off, and neither side gets it for free.
4. Why Lump Sum Investing Has a Mathematical Edge

The advantage comes from a simple assumption. If a diversified portfolio has a positive expected return over long periods, then time in the market has value.
Consider the two paths again. In the lump sum case, $20,000 earns portfolio returns for all 12 months. In the averaging case, only part of the balance is invested at any moment. On average, roughly half the money sits in cash across that year.
Suppose a portfolio expects about 8% a year and cash yields about 2%. The averaging investor earns a blend of the two for the first year. That blend lands closer to 5%, so the gap runs near 3 percentage points on the full amount.
However, this is an expectation, not a promise. Markets do not deliver averages on schedule. Lump sum investing does not always win, and treating it as automatic would misread the evidence.
5. Why Might Investors Prefer DCA?

The case for averaging is strong, though it lives outside the spreadsheet.
Psychological risk. Investing $20,000 and then watching it fall 20% can trigger panic. An investor who sells at that moment locks in a loss the math never predicted.
Sequence of returns. A sharp decline right after a single large purchase feels far worse than the same decline six months later. Regret attaches to the decision, not just the outcome.
Behavioral discipline. A scheduled plan takes the daily forecast out of your hands. For many people, that structure is the difference between investing and stalling.
Risk tolerance. The mathematically optimal strategy is not always the sustainable one. A plan you abandon in month three performs worse than a slightly weaker plan you actually follow.
In short, averaging trades some expected return for a smoother ride. For certain investors, that trade is rational.
6. What Does Historical Data Say?
The useful research question is narrow and testable:
If an investor had a fixed amount available, how often did investing it immediately beat spreading the same amount over 6, 12, or 36 months?
Good studies test that question across long samples, multiple countries, and different asset mixes. They also test across market environments, including bull markets, bear markets, recessions, high inflation periods, high interest rate periods, and major crashes.
Two bodies of work dominate the field. Vanguard’s 2012 paper “Dollar-Cost Averaging Just Means Taking Risk Later” examined rolling 10 year periods in the United States, the United Kingdom, and Australia, with US data reaching back to 1926. Vanguard’s 2023 follow up, “Cost averaging: Invest now or temporarily hold your cash?”, used MSCI World and Bloomberg US Aggregate Bond Index returns from 1976 to 2022.
Between them, these studies cover close to a century of market history.
7. The Data: DCA vs Lump Sum
Chart 1: How often lump sum won
| Study and market | Lump sum win rate |
|---|---|
| Vanguard 2012, United States (12 month averaging) | About 68% |
| Vanguard 2012, average across US, UK, Australia | About 67% |
| Vanguard 2023, global one year rolling periods | About 68% |
| Vanguard 2023, range across markets | 61.6% to 73.7% |
Chart 2: How often DCA won
Because these are two sided outcomes, averaging won the remaining periods. That works out to roughly 26% to 38% of the time, depending on the market and the schedule.
Chart 3: Average difference in outcome
Vanguard’s 2023 analysis found that lump sum investing produced about 1.2% more wealth per year on average for a 40% stock and 60% bond portfolio. The gap widened as equity exposure rose. The 2012 study reported an average advantage near 2.3% for a balanced allocation.
Chart 4: Worst case outcomes
At the 5th percentile of outcomes, averaging finished ahead by 3.6% for an all stock portfolio, 1.4% for a 60/40 mix, and 0.6% for a 40/60 mix. Those are the scenarios investors fear.
Chart 5: Best case outcomes
At the 95th percentile, lump sum extended its lead to 6.4%, 4.6%, and 3.7% for the same three portfolios.
One more finding matters. The longer the averaging window, the better lump sum performed. Cash drag compounds.
8. What Happens During a Market Crash?
Numbers alone can feel abstract, so consider two investors with $20,000 each.
Scenario 1: The market falls 30%
Investor A invests everything on day one. Investor B invests $1,666 monthly.
The market drops 30% over the next six months. Investor A watches the full $20,000 fall to roughly $14,000. Investor B has only about $10,000 deployed, so the paper loss is smaller. Better still, Investor B’s remaining six payments buy shares at depressed prices.
In this path, averaging wins clearly. It also feels far easier to live through.
Scenario 2: The market rises 20%
Now flip the outcome. The market climbs steadily through the year.
Investor A captures the full gain on the full balance. Investor B captures gains only on the money already invested, while the rest earns cash returns. By month 12, Investor B is buying at the highest prices of the year.
Historically, the second path has occurred more often than the first. The S&P 500 has finished positive in roughly three of every four calendar years since 1928.
9. What If the Market Keeps Rising?
Rising markets expose the cost of waiting most clearly.
Assume a portfolio gains 1% each month for a year. Investor A holds $20,000 invested the whole time and ends near $22,540. Investor B averages in, so the average balance invested is roughly half that. Investor B ends closer to $21,200 once cash returns are added.
The difference is not dramatic in one year. Over a long horizon, though, that starting gap keeps compounding. A shortfall of $1,300 at year one becomes considerably larger after 20 years of growth.
This is why the averaging decision is not only about the first 12 months.
10. What If the Market Falls?
Reverse the assumption and the ranking flips.
Assume the market drops 1% each month for a year, then recovers. Investor A bought everything at the highest price of the period. Investor B bought at 12 progressively lower prices, so the average entry cost is lower.
When the recovery arrives, Investor B holds more shares for the same money. That is a genuine advantage, and it is not theoretical.
Even so, averaging guarantees nothing. It helps only when prices fall during the deployment window and then recover. A market that falls after the schedule finishes hurts both investors equally.
11. DCA vs Lump Sum Across Market Conditions
| Market Environment | Likely Advantage |
|---|---|
| Strong rising market | Lump sum |
| Long sideways market | Depends on the path |
| Sharp decline soon after investing | Averaging may help |
| Recovery after a crash | Depends heavily on timing |
| High volatility | Averaging may reduce timing risk |
| Long term upward trend | Lump sum often benefits from earlier exposure |
Notice the hedged language. Nobody knows which environment comes next, which is exactly why the choice stays difficult.
12. What About Risk?
The word “risk” hides two very different problems here.
Financial risk is the potential difference in portfolio value. It is measurable, and the research above quantifies it well.
Behavioral risk is the chance that you panic after a large investment and sell at the bottom. It is harder to measure, yet it often costs more.
This distinction explains why sensible advisors do not simply quote the win rate. A strategy can be mathematically superior and still fail a specific investor. The best plan is the one you can hold through a bad year.
13. Who Should Consider Each Approach?
Lump sum may suit investors who:
- Have a long investment horizon
- Can tolerate short term declines without selling
- Already hold an adequate emergency fund
- Are investing in a diversified portfolio rather than a single stock
- Have stayed invested through past downturns
Averaging may suit investors who:
- Feel real anxiety about investing a large amount at once
- Are especially sensitive to short term volatility
- Want a structured, repeatable process
- Would otherwise keep postponing the decision entirely
None of this is personalized advice. Your tax situation, time horizon, and existing holdings all change the picture, so a licensed financial professional is the right person to review your specifics.
14. What If You Receive a Large Amount of Money?
This debate only applies to money that arrives in a lump. Common sources include:
- Annual bonuses
- Inheritances
- Proceeds from selling a business
- Proceeds from selling property
- A large accumulated savings balance
- Vested stock compensation
Meanwhile, contributions from each paycheck are already a form of averaging by default. There is no lump to deploy, so the question never arises.
For a windfall, the research applies directly. If your horizon is long and the money is earmarked for investment, delay carries a measurable cost. A middle path also exists. Some investors deploy half immediately and average the rest over three to six months, which captures much of the expected advantage while softening the emotional impact.
15. The Hidden Cost of DCA: Cash Drag
Cash drag is the return you give up while money waits on the sidelines.
Think of it this way. Your uninvested $20,000 is not sitting still in a neutral sense. It is invested in cash, and cash has historically earned less than diversified portfolios over long periods. The difference is an opportunity cost, even though it never shows up as a loss on a statement.
The size of that cost changes with conditions. When cash yields 5%, waiting is far less expensive than when cash yields 0.5%. Any fair comparison should account for what the uninvested balance actually earns.
Notably, Vanguard’s research found that averaging still beat holding cash indefinitely about 69% of the time. Waiting to invest is costly. Never investing is worse.
16. The Hidden Risk of Lump Sum: Timing

Now consider the opposite problem. When you invest everything today, you accept today’s price without knowing what it represents.
Today’s level might turn out to be a bargain, an ordinary price, or a temporary peak. Nobody knows in advance, and no reliable method exists for finding out. Forecasts from professionals miss regularly.
Therefore the real question is not “which strategy is better?” A sharper question is this: what are you giving up when you choose one over the other?
Choose lump sum and you give up protection against a poorly timed entry. Choose averaging and you give up expected return. That framing is more honest than any headline verdict.
17. What the Research Actually Says
Here is a fair summary of the evidence.
What the evidence supports
- Across US, UK, Australian, and global markets, immediate investment beat 12 month averaging roughly two thirds of the time.
- The average advantage ran between about 1% and 2.4% per year, depending on asset mix.
- Longer averaging windows produced worse results for the averaging investor.
- Averaging outperformed in a minority of periods, clustered around sharp declines.
- Both strategies beat holding cash indefinitely in most historical periods.
What the evidence does not prove
- Historical results do not guarantee future returns.
- One index does not represent every asset class or every currency.
- Outcomes depend heavily on the length of the averaging period.
- Taxes, trading costs, and prevailing cash yields can change the ranking.
- No study measures how a specific investor will behave in a crash.
For further reading, the primary sources include Vanguard Research, the Journal of Portfolio Management, S&P Dow Jones Indices, the Federal Reserve’s FRED database, and Investor.gov from the SEC.
18. Final Verdict: DCA or Lump Sum?
“Lump sum is better” is too crude a conclusion.
A fairer statement is this. For investors with a long horizon and money already available, immediate investment has held a mathematical advantage, because the money spends more time invested. Averaging remains useful for investors who place high value on reducing timing anxiety and protecting their own discipline.
So the answer depends on your priority:
- If maximizing expected return matters most, lump sum deserves serious consideration.
- If reducing the psychological risk of a single large purchase matters most, averaging is a reasonable approach.
- If you are weighing both, look at the financial outcome and your likely behavior together.
The worst option is neither strategy. Cash left permanently on the sidelines lost to both approaches in almost every historical period studied.
19. Frequently Asked Questions
Is dollar cost averaging better than lump sum investing? Not usually, based on historical returns. Vanguard found immediate investment won about two thirds of the time. Averaging still helps investors who might otherwise panic or delay.
Does lump sum investing usually outperform DCA? Yes, in most historical periods studied. Win rates ranged from roughly 62% to 74% across markets and averaging schedules.
Is DCA safer than investing all at once? It reduces the risk of a poorly timed entry. It does not reduce the risk of owning a falling market once you are fully invested.
What happens if the market crashes after lump sum investing? Your full balance falls with the market. Recovery depends on time and on whether you stay invested through the decline.
How long should I use dollar cost averaging? Research shows shorter windows cost less. Schedules of three to six months preserved more of the expected return than 12 or 36 month plans.
Should I invest a large inheritance all at once? The data favors it for long horizons and diversified portfolios. Your tax position and comfort level matter too, so professional guidance helps.
Is DCA useful in a bear market? It can be, since falling prices lower your average entry cost. Nobody can confirm a bear market is underway until afterward.
Does DCA reduce investment risk? It reduces entry timing risk during the deployment window only. Market risk stays the same once your money is fully invested.
What does historical data say about DCA vs lump sum? Across nearly a century of data in several countries, immediate investment produced higher ending values in about two thirds of periods.
Can you lose money with dollar cost averaging? Yes. Averaging spreads out your purchases, yet it offers no protection against a long term decline in the assets you own.
20. Sources and Methodology
Research Methodology
This article summarizes published historical research rather than a proprietary backtest. The primary sources are Vanguard’s 2012 study “Dollar-Cost Averaging Just Means Taking Risk Later,” covering rolling 10 year periods in the United States (1926 to 2011), the United Kingdom, and Australia, and Vanguard’s 2023 study “Cost averaging: Invest now or temporarily hold your cash?”, covering one year rolling periods from 1976 to 2022 using the MSCI World Index and the Bloomberg US Aggregate Bond Index. Both compare an immediate investment against equal installments over 3, 6, 12, and 36 month windows. Returns are measured before taxes and transaction costs unless stated otherwise. Illustrative examples using $20,000 are hypothetical and do not represent any specific investment.
Datasets and sources
- Vanguard Research, “Cost averaging: Invest now or temporarily hold your cash?” (2023)
- Shtekhman, Tasopoulos, and Wimmer, “Dollar-Cost Averaging Just Means Taking Risk Later,” Vanguard (2012)
- Rozeff, M., “Lump-Sum Investing Versus Dollar-Averaging,” Journal of Portfolio Management (1994)
- MSCI World Index and Bloomberg US Aggregate Bond Index return series
- S&P Dow Jones Indices, S&P 500 annual return history
- Federal Reserve Economic Data (FRED), US Treasury bill rates
- Investor.gov, US Securities and Exchange Commission