
America’s most expensive housing markets are concentrated in coastal technology, finance, resort and high-income employment centers. A luxury-market threshold is a useful way to compare the upper end without letting a handful of mansions distort the entire market.
Key Takeaways
- Bridgeport–Stamford–Danbury, Connecticut leads this ranking based on luxury-market price threshold.
- The data snapshot is 2026 Realtor.com luxury-market analysis; fast-moving values should be verified again before publication.
- Luxury thresholds reveal where scarce land, high incomes and lifestyle demand create especially expensive upper-end housing.
- The ranking measures one dimension only and should not be treated as personalized financial or investment advice.

How We Ranked the Top 10
This list uses the price threshold for luxury listings in major metro areas rather than median home price. It therefore measures the high-end market, not what a typical household pays.
The primary comparison metric is luxury-market price threshold. The ranking is designed to be transparent and reproducible rather than subjective.
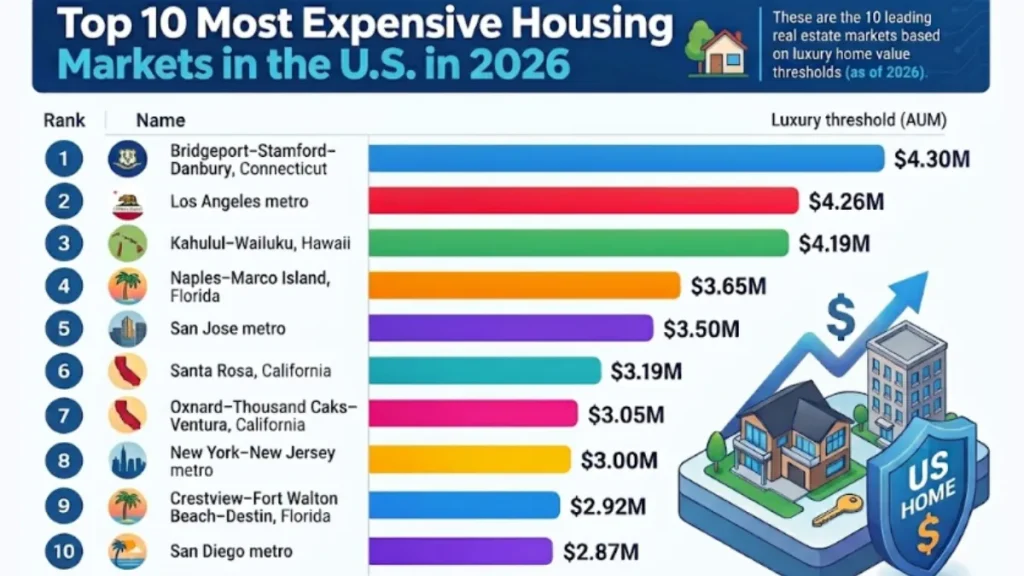
Top 10 at a Glance
| Rank | Name | Latest figure / basis |
|---|---|---|
| 1 | Bridgeport–Stamford–Danbury, Connecticut | luxury threshold about $4.30M |
| 2 | Los Angeles metro | about $4.26M |
| 3 | Kahului–Wailuku, Hawaii | about $4.19M |
| 4 | Naples–Marco Island, Florida | about $3.65M |
| 5 | San Jose metro | about $3.50M |
| 6 | Santa Rosa, California | about $3.19M |
| 7 | Oxnard–Thousand Oaks–Ventura, California | about $3.05M |
| 8 | New York–New Jersey metro | about $3.00M |
| 9 | Crestview–Fort Walton Beach–Destin, Florida | about $2.92M |
| 10 | San Diego metro | about $2.87M |
The Top 10 in Detail
1. Bridgeport–Stamford–Danbury, Connecticut
At No. 1, Bridgeport–Stamford–Danbury, Connecticut records luxury threshold about $4.30M on the metric used for this ranking. Housing and rental statistics can vary significantly within a metro area, so this number should be treated as a market-level benchmark. Neighborhood, property size, building age, taxes, insurance, financing costs and local supply conditions can create very different outcomes for individual households. Readers comparing locations should therefore pair the headline figure with local income and cost-of-living data.
2. Los Angeles metro
Los Angeles metro takes the No. 2 position, with about $4.26M in the latest snapshot. Housing and rental statistics can vary significantly within a metro area, so this number should be treated as a market-level benchmark. Neighborhood, property size, building age, taxes, insurance, financing costs and local supply conditions can create very different outcomes for individual households. Readers comparing locations should therefore pair the headline figure with local income and cost-of-living data.
3. Kahului–Wailuku, Hawaii
Ranked No. 3, Kahului–Wailuku, Hawaii stands at about $4.19M based on the methodology above. Housing and rental statistics can vary significantly within a metro area, so this number should be treated as a market-level benchmark. Neighborhood, property size, building age, taxes, insurance, financing costs and local supply conditions can create very different outcomes for individual households. Readers comparing locations should therefore pair the headline figure with local income and cost-of-living data.
4. Naples–Marco Island, Florida
At No. 4, Naples–Marco Island, Florida records about $3.65M on the metric used for this ranking. Housing and rental statistics can vary significantly within a metro area, so this number should be treated as a market-level benchmark. Neighborhood, property size, building age, taxes, insurance, financing costs and local supply conditions can create very different outcomes for individual households. Readers comparing locations should therefore pair the headline figure with local income and cost-of-living data.
5. San Jose metro
San Jose metro takes the No. 5 position, with about $3.50M in the latest snapshot. Housing and rental statistics can vary significantly within a metro area, so this number should be treated as a market-level benchmark. Neighborhood, property size, building age, taxes, insurance, financing costs and local supply conditions can create very different outcomes for individual households. Readers comparing locations should therefore pair the headline figure with local income and cost-of-living data.
6. Santa Rosa, California

Ranked No. 6, Santa Rosa, California stands at about $3.19M based on the methodology above. Housing and rental statistics can vary significantly within a metro area, so this number should be treated as a market-level benchmark. Neighborhood, property size, building age, taxes, insurance, financing costs and local supply conditions can create very different outcomes for individual households. Readers comparing locations should therefore pair the headline figure with local income and cost-of-living data.
7. Oxnard–Thousand Oaks–Ventura, California
At No. 7, Oxnard–Thousand Oaks–Ventura, California records about $3.05M on the metric used for this ranking. Housing and rental statistics can vary significantly within a metro area, so this number should be treated as a market-level benchmark. Neighborhood, property size, building age, taxes, insurance, financing costs and local supply conditions can create very different outcomes for individual households. Readers comparing locations should therefore pair the headline figure with local income and cost-of-living data.
8. New York–New Jersey metro
New York–New Jersey metro takes the No. 8 position, with about $3.00M in the latest snapshot. Housing and rental statistics can vary significantly within a metro area, so this number should be treated as a market-level benchmark. Neighborhood, property size, building age, taxes, insurance, financing costs and local supply conditions can create very different outcomes for individual households. Readers comparing locations should therefore pair the headline figure with local income and cost-of-living data.
9. Crestview–Fort Walton Beach–Destin, Florida

Ranked No. 9, Crestview–Fort Walton Beach–Destin, Florida stands at about $2.92M based on the methodology above. Housing and rental statistics can vary significantly within a metro area, so this number should be treated as a market-level benchmark. Neighborhood, property size, building age, taxes, insurance, financing costs and local supply conditions can create very different outcomes for individual households. Readers comparing locations should therefore pair the headline figure with local income and cost-of-living data.
10. San Diego metro
At No. 10, San Diego metro records about $2.87M on the metric used for this ranking. Housing and rental statistics can vary significantly within a metro area, so this number should be treated as a market-level benchmark. Neighborhood, property size, building age, taxes, insurance, financing costs and local supply conditions can create very different outcomes for individual households. Readers comparing locations should therefore pair the headline figure with local income and cost-of-living data.
What This Ranking Tells Us
Luxury thresholds reveal where scarce land, high incomes and lifestyle demand create especially expensive upper-end housing.
Why housing comparisons are difficult
Real estate is local. Even within the same city, rent and sale prices can vary sharply by neighborhood, school district, commute, property type and building quality. National portals also use different samples and definitions, so two reputable providers can publish different medians for the same month.
Renting versus buying

A monthly-payment comparison is only the first layer. Buyers face closing costs, maintenance, property taxes and the opportunity cost of a down payment, but they can also build equity and benefit from long holding periods. Renters preserve flexibility and avoid property-price risk but may face future rent increases. The correct comparison depends heavily on how long a household expects to stay.
Important Limitations
Rankings simplify complex subjects. Market capitalization changes with share prices; earnings can include unusual items; AUM moves with flows and asset prices; bank assets depend on accounting definitions; macroeconomic data can be revised; savings rates can change without notice; and real-estate samples differ by provider. For that reason, InvestorBytes recommends keeping the data date visible and linking to the underlying source.
Financial disclaimer: This content is for general informational and educational purposes only and is not personalized financial, investment, tax or legal advice.
Frequently Asked Questions
Who ranks No. 1 in this list?
Bridgeport–Stamford–Danbury, Connecticut ranks first based on luxury-market price threshold in the 2026 Realtor.com luxury-market analysis data snapshot used for this article.
How often can this ranking change?
Fast-moving market, rate and price rankings can change daily. Annual macroeconomic and regulatory datasets usually change less frequently but may still be revised.
Does a higher ranking mean it is a better investment?
No. Size, yield, past return or AUM is not an investment recommendation. Risk, valuation, time horizon and personal financial circumstances matter.
Why might another website show different numbers?
Sources can use different reporting dates, currencies, definitions, data vendors or methods. That is why this article states its metric and data date.
How should this article be updated?
Before a future republish, refresh the comparison table from the cited primary or high-quality data source, change the data-as-of date, and revise any item whose rank moved materially.